UK city house prices growing at 5.5%, up from 3.7% last year supported by seasonal uplift in sales
– Edinburgh, Nottingham, Manchester and Birmingham registering strongest year on year growth
– Aberdeen and Cambridge continue to post price falls while growth in London stabilises but prices falling in real terms
– It takes 17 weeks to sell a property in London, longer than any other city covered by the index as sales in the capital fail to keep pace with new supply
The latest Hometrack UK Cities House Price Index reveals that overall city house price inflation is running at +5.5% for the 12 months to March 2018, up from +3.7% a year earlier. The improved annual growth rate has been driven by cities like Edinburgh (+8.1%), Nottingham (+8.0%), Manchester (+7.4%) and Birmingham (+7.0%) where above average growth is being sustained by attractive affordability and a lack of housing for sale.
Meanwhile, at the other end of the spectrum, Aberdeen (-6.6%), Cambridge (-1.2%) and London (+1.6%) are lagging behind, despite evidence of the usual seasonal increase in housing sales across the country in the first three months of 2018
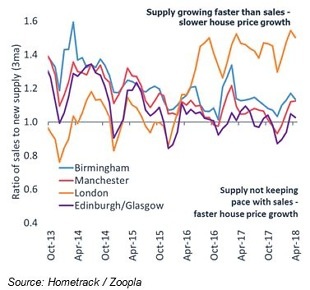
One of the reasons for weak growth in London is the fact that the level of sales is not keeping pace with new supply coming to the market. There are 1.5 homes coming to the market for every one home sold. This is a result of weaker demand over the last 18 months and a reluctance by sellers to accept lower prices. The net result is longer sales periods where London has the longest time to sell of all UK cities at 17 weeks.
Annual house price inflation across London remains positive at +1.6% with no signs of moving into negative territory in the near term. Prices have registered a small increase (+0.9%) over the last 3 months suggesting the downward pressure on prices in London has moderated for now.
Other cities such as Oxford and Cambridge are also experiencing supply of homes for sale growing faster than sales. Elsewhere in the country the balance between sales and new supply is much closer. In cities like Edinburgh, Manchester, Nottingham and Birmingham house price growth is above average and we find that new supply is broadly in line with sales. This creates a scarcity of homes for sale and together with attractive affordability is supporting robust house price growth.
Richard Donnell, insight director at Hometrack says:
“The headline rate of city house price growth continues to be driven by above average increases in regional cities where attractive affordability and a lack of housing for sale is supporting house price inflation. This latest report identifies other cities such as Cardiff, Leeds, Newcastle and Sheffield as having recorded a sustained uplift in the rate of growth over the last 12 months.
Donnell continues:
“Whilst demand for housing in London has cooled over the last 18 months and the rate of house price growth has slowed there are some signs that underlying market conditions are improving. Last month we reported that residential values in London were falling across more than two fifths of postcodes and this has narrowed to 36% over March.
Falling asking prices over the last 2 years, especially in central areas of London, together with deeper discounts from asking to achieved prices and greater realism on the part of sellers is likely to support sales rates and reduce the downward pressure on prices. 2018 could be the year when housing turnover in London starts to plateau having fallen by almost a fifth since 2014.”
Figure 1 – House price growth UK cities
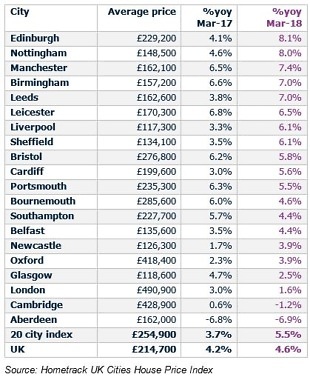
Figure 2 – Ratio of sales to new supply (3 month average)