House prices falling across 63% of London local authorities but quarterly growth shows capital’s housing market is stabilising
– Prices down in 29 (or 63%) of local authorities over the past 12 months in the London City index covering London and the surrounding commuter belt
– London City house prices fall 0.4% year-on-year but with average prices posting small gains over each of the last 6 months
– UK city house prices up 3.2% annually, down from 3.8% a year ago.
– House price growth across 5 large regional cities more than 6% per annum
House prices in nearly two-thirds (63%) of London local authorities have fallen year-on-year but the proportion of markets registering a decline in values is expected to slow over the remainder of the year, according to the latest Hometrack UK Cities House Price Index.
Prices fell in 29 local authorities covering London and the commuter belt over the past 12 months (see figure 1). The wealthy borough of Kensington in Chelsea suffered the worst year-on-year fall, with prices falling 4.9% to an average of £1.17 million.
It is followed by other prosperous boroughs such as Camden, and Hammersmith and Fulham, where prices slid 4.3% and 3.1% to £737,000 and £707,000, respectively.
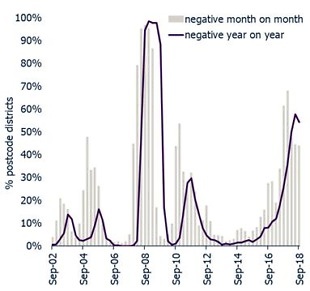
However, new analysis also reveals that the number of London postcodes registering month-on-month price falls has dropped to 44% from a peak of 70% in December 2017 (see figure 2).
This means that 56% of postcodes are now registering month-on-month price gains, implying the proportion of markets registering annual price falls will slow further over the rest of the year.
Although the London City Index as whole has registered a 0.4% decline year-on-year, lower value markets in outer and surrounding London have registered modest price rises over the last year as affordability has been less stretched than in central areas.
Prices in Barking and Dagenham rose 2.3% year-on-year to an average of £296,400. Havering, Spelthorne and Bexley experienced the next highest rise in home values, with prices increasing1.4% year-on-year in each area.
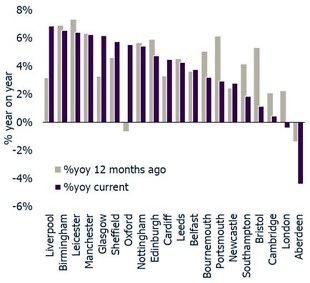
On a national level, house prices in UK cities were up 3.2% annually in September, driven by strong growth in regional cities outside the south east of England (see figure 4).
Prices are rising fastest on an annual basis in Liverpool (+6.9%), followed by Birmingham (6.5%), Leicester (+6.4%), Manchester (+6.2%) and Glasgow (+6.2%) – see figure 3. With growth of over 6%, house price inflation in these five cities remains more than twice the rate of earnings growth (2.7%) as prices continue to rise off a low base and affordability remains attractive.
Richard Donnell, Insight Director at Hometrack, says: ““London’s housing market has registered a major slowdown in price growth over the last 2 years as stretched affordability levels, multiple tax changes and weaker market sentiment have all impacted the demand for housing. Turnover has fallen much more than prices which tend to be ‘stickier’ on the way down with few households being forced sellers.
Donnell continues: “Our latest analysis reveals price falls are concentrated in inner London while values continue to rise slowly in the most affordable parts of outer London and the main commuter areas. Price growth has firmed over the last six months but the annual rate of growth remains negative and we expect the current re-pricing process to run into 2019.”
Donnell adds: “City level house price growth remains well above average in the most affordable cities. While the rate of growth has moderated slightly prices in five cities are still rising twice as fast as the growth in earnings. We expect continued price growth in the most affordable markets over the remainder of the year.”
Figure 1 – London City house price index – London’s constituent local authorities

Figure 2 – % London City postcodes registering price falls

Figure 3 – House price growth – % yoy current / 12m ago

Figure 4 – City level summary

