House prices rising fastest in Edinburgh and Manchester as growth in London reaches 9-year low
– Edinburgh and Manchester registering annual house price growth of 7.1% and 7.0% respectively, the latest Hometrack UK Cities House Price Index reveals
– Gap between house prices in London and other UK cities is narrowing, as year-on-year growth in the capital slows to a 9-year low of 0.4%
– Hometrack’s analysis of recent housing cycles shows regional cities could see further price rises of up to 20-25%
– Average home in London is now 4x the value of a home in Liverpool and 3x the price of an average house in Manchester
The latest Hometrack UK Cities House Price Index reveals house prices are rising faster in Edinburgh (7.1%) and Manchester (7.0%) than in any other major UK city, while annual house price growth in London has slowed to a 9-year low of 0.4%.
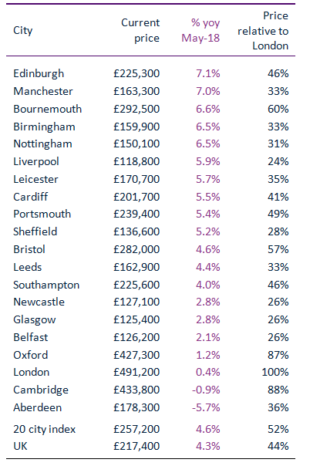
House price growth across the 20 cities covered by the Index ranges from 7.1% to -5.7%, with Aberdeen and Cambridge the only two cities registering price falls over the last 12 months (see Figure 1).
However, prices are now falling in 43% of London’s local authority areas by as much as -3.2%, which explains why the headline rate of growth in the capital has slowed to 0.4%. London is one of five cities including Cambridge, Oxford, Belfast and Aberdeen, where house prices are falling in real terms as growth remains below the current rate of consumer price inflation (2.4%).
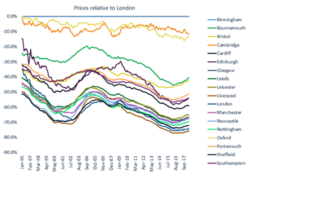
As house prices in regional cities continue to significantly outpace London, the difference in value of homes in these cities is beginning to narrow. The average home in London is currently worth £491,200, which is considerably higher than the average cost of a house in most other UK cities, but the gap is beginning to close (see figure 2).
The relative price difference with London currently ranges from 88% in Cambridge to 24% in Liverpool. This means that the average value of a home in London is x4 times more expensive than in Liverpool, x3 times more expensive than in Manchester and just over twice as expensive than in Edinburgh (see figure 1).
The relative pricing of housing in London compared to other UK cities reflects variations in the timing and levels of economic growth, incomes, job creation, available supply and the net flow of investment into housing.
Hometrack expects the gap in prices between London and other UK cities to close further over the next 12 to 24 months as London house prices under-perform the rest of the market. This is following a similar to pattern to 2002-2005 (see figure 2). At that time, London house price growth was weak after a period of out-performance from 1996-2000. In contrast regional housing markets had under-performed and only started to register strong growth from 2001 onwards which closed the gap to London.
Richard Donnell, Insight Director at Hometrack says: “We expect house prices to keep rising across regional cities such as Birmingham, Manchester and Edinburgh over the next two to three years. During this time house price growth in London will remain flat with annual price rises of approximately 0-2%. As a result, the gap between house prices in cities outside of the South East and house prices in London will continue to contract.
Donnell continues: “Naturally, the relative price gap between cities fluctuates over the course of the housing cycle as supply and demand is affected by factors such as economic growth, job creation, wage increases and the flow of new investment. This has certainly been evident in Aberdeen where the fall in the oil price has impacted housing demand and house prices.
Donnell concludes: “Hometrack expects that Manchester and Birmingham will close the gap to London fastest in the coming years as these cities are likely to see the strongest jobs growth. The level of house price inflation seen in large regional cities during the last peak, between 2000 and 2003, gives a good indication of how much prices may rise this time around. If history is to repeat itself and these cities are to get back to where they were, then prices could increase by as much as 20-25%.”
Figure 1 – City level summary, May 2018

Source: Hometrack UK Cities House Price Index
Figure 2 – City house prices relative to London
 Source: Hometrack UK Cities House Price Index
